Scan after the close
Review supported US stocks and ETFs using completed daily bars after every market close.
After-close swing setup discovery
After each US close, choose the Bullish Radar for VCP-style setups tightening near their highs or the Bearish Radar for weak stocks consolidating near support. Review the daily chart, see what changed, and decide which setups belong on your watchlist.
Browse ranked setups and look up additional stocks free. No card required; results are one session delayed.
Bullish Radar
Illustrative dataWhy AAPL is Ready
Trend
100
Tight
64
RS
91
Volume
58
Ticker labels are recognizable; every score, state, and value shown here is illustrative and not current market data or a recommendation.
A repeatable nightly workflow
Two independent radars organize bullish VCP setups and bearish setups without pretending that the same score explains both directions.
Review supported US stocks and ETFs using completed daily bars after every market close.
Review bullish contraction near highs or bearish consolidation near support in separate ranked radars.
Follow tightening, readiness, breakouts or breakdowns, and the outcomes that follow.
The pattern
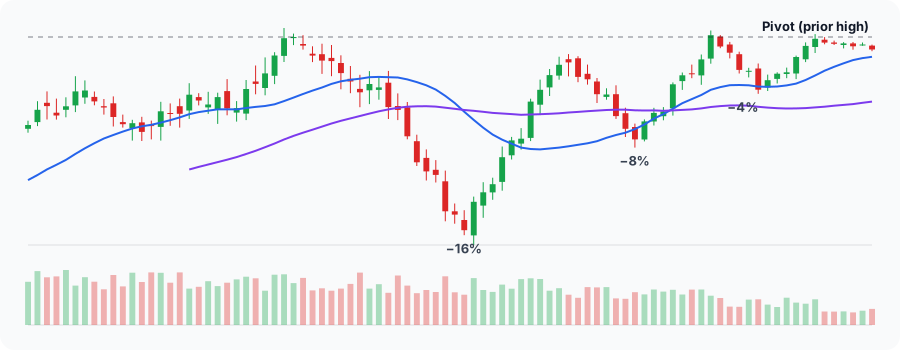
TraderSight looks for the volatility contraction pattern (VCP): an uptrend that pauses near its 52-week high while each pullback gets smaller. Every setup in the app opens to this Price Action view, built from real daily data, so you can check the contraction yourself.
How the VCP screener works →Start with what a VCP means in stock trading, then follow the after-close VCP screening checklist.
Bullish product preview
This illustrative preview follows bullish setups through Developing, Tightening, Ready, and Breakout. In the app, switch to the separate Bearish Radar for Watch, Ready, Breakdown, and later outcomes. Each radar has its own score model.
Explore the Bullish Radar preview →Nightly review guides
Learn how to review a ranked shortlist, interpret tightening price behaviour, and follow a setup as its condition changes across sessions.
Workflow
Use completed daily data to compare ranked setups, review changes, and prune a concise watchlist.
Setup quality
See how contraction fits with trend, volume behaviour, relative strength, proximity, and liquidity.
Progression
Understand developing, tightening, ready, breakout, extended, and invalidated states.
Scan by universe: Nasdaq-100 swing setups (free) · S&P 1500 VCP scanner · ETF swing setup scanner
Transparent by design
Every rule behind the radar is published. The app shows you which ones a setup passes, so you can check the chart and decide for yourself.
Bullish Ready means contraction near a prior high in a qualified uptrend. Bearish Ready means a qualifying downtrend has tightened near support. The methodology page keeps the models separate.
Takeover stocks pinned in a narrow range are marked Invalidated, breakouts with no new high for 10 sessions go back to base-building, and stocks with suspect price data, such as bad prints or unadjusted splits, are skipped.
A score of 83 is not an 83% chance of anything. It ranks chart quality for review. Illustrative data is clearly labelled, and nothing on the site is a trade recommendation.
Start on Free with no card. First-time subscribers receive a card-required trial with broader supported-market coverage than Free. Checkout shows the trial length and first billing date. Cancel from the billing portal; when paid access ends, the account returns to Free without deleting anything.
Built for end-of-day swing traders
TraderSight gives self-directed swing traders concise, explainable shortlists built from completed daily data. Review bullish VCP setups tightening near their highs or bearish setups consolidating near support, then follow how each candidate changes across sessions.
It is designed for deliberate evening research, not intraday alerts, automated trading, or personalized advice.
Explore the bullish VCP stock screener →After-close swing trading routine
Browse ranked setups and look up additional stocks. Free results are one session delayed; no card required.