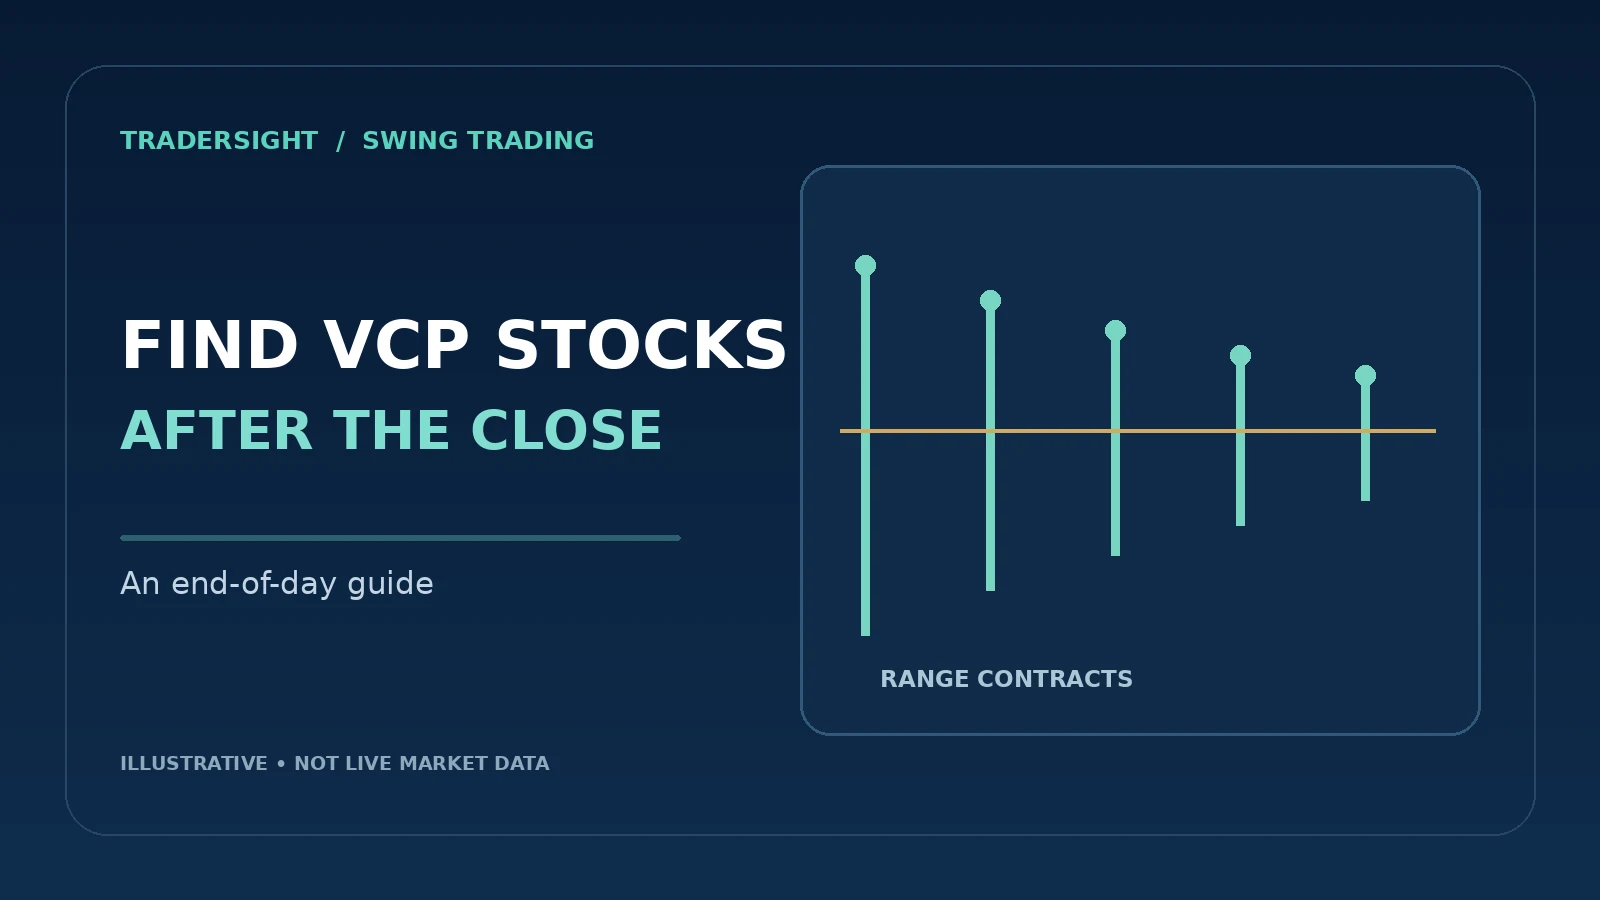
Learning how to find VCP stocks after the market close is mostly a matter of turning a visual pattern into rules you can check the same way every night. A volatility contraction pattern is a base in which each pullback is smaller than the last, volume fades, and price ends up coiled near a prior high. Spotting one by eye across hundreds of charts is slow and inconsistent. An end-of-day VCP screener built on completed daily bars does the first pass for you, so the evening goes into reviewing a handful of stocks tightening near their 52-week highs instead of scrolling through all of them.
This guide shows what to check after the close, how to read the scores, and when a promising candidate still needs more work on the chart.
For a repeatable after-close scan:
- Filter for liquid US stocks with enough daily history.
- Compare recent range and volume with their earlier baselines.
- Check trend and distance from the prior 52-week high.
- Inspect the chart for shrinking pullbacks, then mark the pivot and invalidation level.
The TraderSight VCP stock screener automates the first pass. Its numeric rules identify candidates; the daily chart is where you check whether those candidates actually have a convincing contraction pattern.
Why the close is the right time to scan
Intraday, a range can look tight at noon and expand by 3:30 pm, and a half-day of volume always looks like a dry-up next to full sessions.
Once the regular session ends, every candidate has a complete daily bar, measured the same way as every other stock on the list. TraderSight uses only completed daily bars and publishes results in the evening on weekdays, from roughly 5:00 pm ET onward.
Start with a universe worth scanning
A contraction pattern on a thinly traded stock is not the same thing as one on a liquid leader. Before measuring anything, narrow the field:
- Price: close at $5 or more.
- Liquidity: 20-session average dollar volume of at least $5M.
- History: at least 250 sessions, so a 52-week high actually means something.
TraderSight applies these filters to roughly 1,600 liquid US stocks and ETFs drawn from the S&P 1500, Russell 1000, Nasdaq-100, Dow 30, and a curated ETF list.
The four measurements behind an end-of-day VCP screener
Each measurement answers one question about the chart.
Is the stock in an uptrend?
A VCP forms after strength, not during a decline. The trend score gives 25 points for each of four conditions: close above the 50-day average, the 50-day average higher than it was 10 sessions ago, close above the 20-day average, and the 20-day above the 50-day. See moving-average structure for why each one matters.
Is the range contracting?
This is the “volatility contraction” part. Compare the average daily high-to-low range of the last 10 sessions with the average of the 40 sessions before that. A ratio of 1.0 means no contraction and scores 0. A ratio of 0.5, where recent ranges are half the baseline, scores 100. A ratio of 0.75 scores 50. The tightening guide covers the details.
Is volume drying up?
The same 10-versus-40 comparison applied to volume. Quiet volume during the final contraction suggests fewer holders are selling. See volume dry-up.
How close is price to the high?
Proximity compares the close with the highest high of the prior 252 sessions. The score is 100 minus 500 times the percentage below that high, so a close 5% below scores 75, and 20% or more below scores 0. A tight base far from its high is still a base, but it is not yet a VCP near its pivot. The 52-week high guide explains why this matters.
Worked example: scoring one fictional stock
Suppose a fictional stock, Demo V, finishes Tuesday with these completed-bar values:
| Input | Value |
|---|---|
| Close | $76.80 |
| Highest high, prior 252 sessions | $80.00 |
| 50-day average (today / 10 sessions ago) | $71.40 / $69.90 |
| 20-day average | $75.10 |
| Average daily range, last 10 sessions | $1.40 |
| Average daily range, prior 40 sessions | $2.10 |
| Average volume, last 10 / prior 40 sessions | 1.2M / 1.6M shares |
Working through each score:
- Trend: $76.80 is above $71.40, the 50-day rose from $69.90, $76.80 is above $75.10, and $75.10 is above $71.40. That is 4 × 25 = 100.
- Tightness: $1.40 ÷ $2.10 = 0.667. (1 − 0.667) ÷ 0.5 × 100 = 67.
- Volume: 1.2M ÷ 1.6M = 0.75, which scores 50.
- Proximity: ($80.00 − $76.80) ÷ $80.00 = 4.0% below. 100 − (500 × 0.04) = 80.
TraderSight’s Ready state requires proximity of at least 75, tightness of at least 50, and trend of at least 75. Assume Demo V is still building its base and has no structure break that would invalidate it. It clears all three checks, so it would be labelled Ready. If Wednesday closes at $80.40, above the $80.00 prior high, it becomes a Breakout.
Now compare Demo W, a different fictional stock with the same tightness (67) and volume (50) scores and a close still above its rising 50-day average. It closes at $70.40 against an $80.00 prior high. That is 12% below, so proximity is 100 − 60 = 40, and it fails the Ready test. With tightness of 40 or more, volume of 30 or more, and trend of at least 50, it would sit in Tightening instead: worth watching, but not yet near its pivot.
None of these numbers are probabilities. A Ready score of 80 does not mean an 80% chance of anything. It describes how the chart measures against the rules.
Review the shortlist, then the charts
Check participation before treating the shortlist as a set of independent opportunities. The guide to why breakouts fail when market breadth is weak explains that market-context review. A list of qualifying stocks does not guarantee broad support for their next moves.
Start with the stocks that pass the screen, then check how their bases formed. Recent daily ranges can look small when an earlier earnings session was unusually volatile. Look for progressively smaller pullbacks across the base before planning a trade from a Ready label.
For each stock that passes, check the daily chart:
- Are the pullbacks actually shrinking? The 10-versus-40 ratio can improve because of one quiet week. Look for two to four progressively smaller swings.
- Where is the pivot? Mark the top of the final tight range and the prior high. See pivot points.
- Is there an event ahead? Earnings or other scheduled news can override any pattern overnight.
- What would invalidate it? Write down the level. In TraderSight, a close below the 50-day average moves any setup to Invalidated.
Keep the result short. The after-close swing trading routine covers how to turn this review into a nightly habit.
Common mistakes when screening for VCPs
Calling any flat chart a VCP
A sideways range without a prior uptrend is just a range. The trend conditions exist to filter these out.
Trusting tightness alone
A stock frozen in a razor-thin range after a large gap may be a pending cash acquisition. Its next repricing can depend on deal terms or new bids rather than a VCP breakout thesis. TraderSight excludes detected pins; see why a tight chart can be a takeover.
Ignoring distance from the high
Tightening 15% below a high is early. Treating it like a pivot-ready setup leads to entries in the middle of a base, with wider stops and more waiting.
Keeping stale breakouts on the list
A breakout that makes no new high for 10 sessions is no longer a fresh breakout. TraderSight returns it to the base-building states so the list does not fill with old moves.
Putting it together
To find VCP stocks after market close, filter for liquid stocks with enough history, score trend, range contraction, volume dry-up, and proximity to the 52-week high, then spend your time on the few charts that pass. The value of an end-of-day VCP screener is applying those checks consistently across the whole universe every night, and showing which stocks tightening near their 52-week highs changed state since yesterday.
See what the VCP stock screener checks each night, or use the volatility contraction pattern guide to practise reading a base. Once you have chosen an entry and stop, the position size calculator handles the share count.
Start free with TraderSight, no card required. Browse ranked setups and look up additional stocks. Free results are one session delayed. See paid plans and trial details for the latest after-close radar, or explore the free swing trading calculators.
Put this review into practice
Review real daily charts with a setup score and an explanation of the current state. Browse ranked setups and look up additional stocks free, with results one session delayed.
Educational only. Not investment advice.