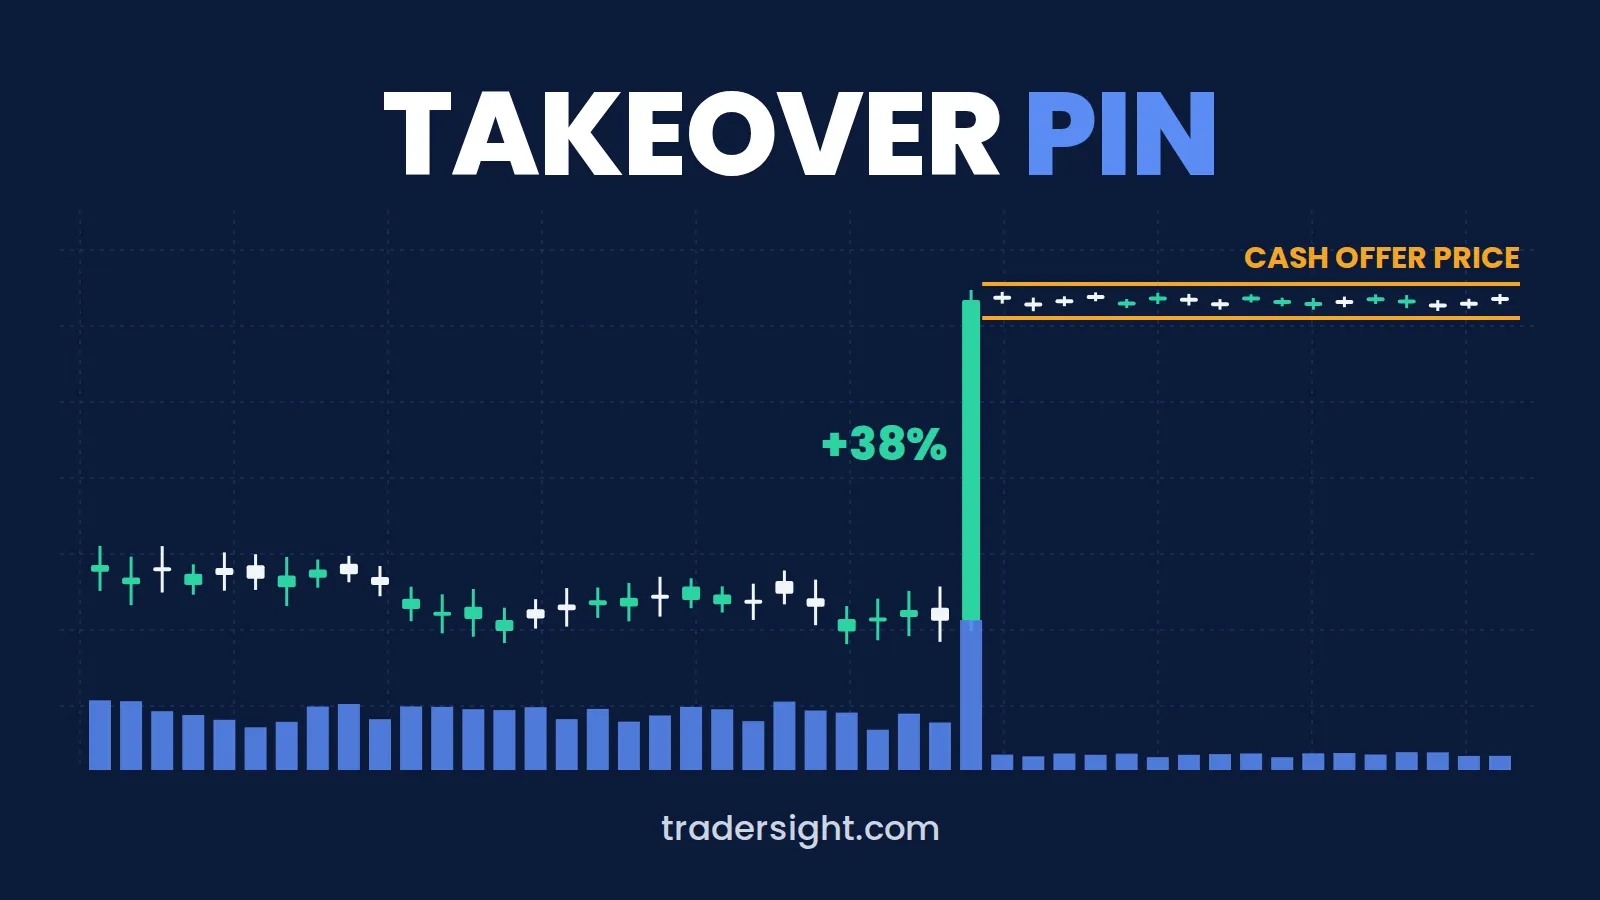
If you screen for tight bases near highs, some of the best-looking charts you find will be stocks that have already been bought. After a cash acquisition is announced, the share price jumps toward the offer and then stops moving. Daily ranges shrink to a fraction of a percent and volume collapses. On paper it is a perfect volatility contraction. In practice there is nothing left to trade.
This guide explains why a stock trades flat after a buyout announcement, why that pattern fools volatility contraction (VCP) screeners, and how to tell a takeover pin from a real base.
What happens to a stock price after a buyout announcement
When a company agrees to be acquired for cash, the buyer commits to paying a fixed amount per share at closing, for example $52. From that moment the stock stops trading on earnings, sector moves, or chart patterns. Its value is mostly that $52, discounted for two things:
- Time. Closing can take three to twelve months, and money tied up until then could earn interest elsewhere.
- Risk. Regulators can block the deal, financing can fail, or shareholders can vote it down.
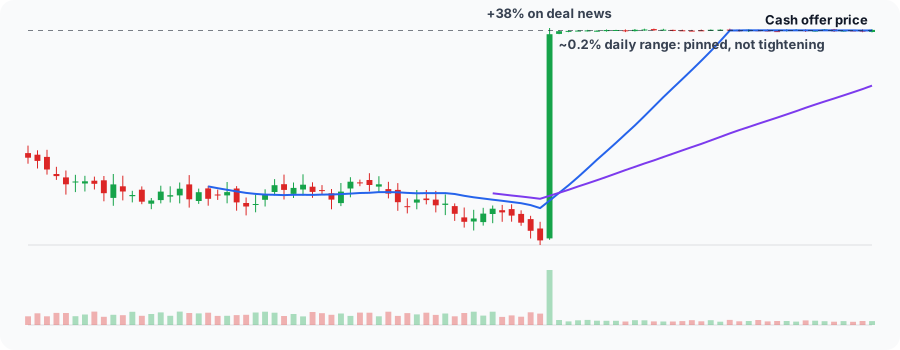
The stock therefore opens near, but below, the offer price, often in a single gap of 20–50%. Then it settles into a narrow band and drifts slowly toward the offer as closing approaches.
Why a stock stays flat: the merger-arbitrage spread
The difference between the market price and the offer is the merger-arbitrage spread. Suppose the offer is $52.00 and the stock trades at $51.10. The spread is $0.90, or about 1.8%. If the deal closes in six months, that is roughly a 3.5% annualised return for waiting.
Merger-arbitrage funds buy at that discount and hold until closing. Their bids sit just under the offer, and few sellers will accept much less. That makes the price sticky. On a typical day the stock moves a few cents, and daily ranges of 0.1–0.4% are common.
| Deal type | What the target stock tracks | Chart after announcement |
|---|---|---|
| All-cash offer | The fixed cash price, less the spread | Flat line just under the offer: the classic pin |
| All-stock offer | The acquirer’s share price × the exchange ratio | Moves with the acquirer’s stock, not a pin |
| Cash and stock | A blend of both | Partly pinned, partly tracking the acquirer |
| Tender offer | The tender price, until the offer expires | Pinned, often with a shorter timeline |
Only cash-heavy deals produce the flat line. In a stock-for-stock deal, the target moves with the acquirer, so it can still look like an ordinary chart.
Why takeover pins fool VCP and tight-base screeners
A volatility contraction screener compares recent daily ranges with earlier ones and rewards shrinking ranges near a high. A pinned stock satisfies all of those conditions:
- Tightness. The recent daily range is tiny compared with the weeks before the news.
- Near the 52-week high. The offer is usually a premium, so the stock sits at or near its high.
- Uptrend. The gap lifts the 10-, 20-, and 50-day averages, so the trend checks pass.
- Volume dry-up. After the announcement-day spike, volume fades to a trickle.
The result can be a very high setup score. When we audited TraderSight’s own results in September 2026, every stock labelled Ready under the original rules had this pinned shape: one big gap, then daily ranges of 0.2–0.4%. That finding is why the rules now exclude them.
A real volatility contraction pattern looks different. Pullbacks get smaller in steps, for example 16%, then 8%, then 4%, and the stock still trades with a daily range of 1% or more. The tight consolidation guide compares a loose base with a tight one.
How to spot a takeover pin
Check for these signs before treating a very tight chart as a setup:
- One large gap, then almost nothing. A single-day move of 10% or more, followed by weeks of closes inside a band well under 1% wide.
- Daily ranges near 0.1–0.5% of price. Liquid stocks in genuine bases rarely stay below about 1%.
- A volume spike, then a trickle. The announcement day trades many times normal volume; later sessions trade a fraction of it.
- A round number just overhead. The price hugs a level slightly below a figure such as $52.00.
- No reaction to the market. The stock barely moves on days when its sector moves 2–3%.
- The news. Searching the company name with “to be acquired” or “definitive agreement” usually settles it within a minute.
When a pinned stock does move
A pin ends in one of three ways, and none of them is a chart breakout:
- The deal closes. Shareholders receive the cash and the stock is delisted.
- A higher bid arrives. A competing buyer or a raised offer can gap the price up again.
- The deal breaks. Regulators block it or financing fails, and the stock often falls back toward its pre-announcement price, sometimes further.
These are event-driven trades that depend on legal and regulatory judgement. Chart analysis has little to say about them.
How TraderSight keeps takeover pins off the radar
TraderSight flags a stock as pinned when either condition holds:
- its 10-session average daily range is below 0.6% of price and it gapped 10% or more in the last 90 sessions; or
- its 10-session average daily range is below 0.3% of price, whether or not it gapped.
Pinned stocks are excluded from Ready and show the reason, “Price is pinned in an unusually narrow range, typical of a pending acquisition,” so you can see why a tight-looking chart was set aside. ETFs are not checked for pins, because bond and cash-like funds are handled by a separate low-volatility rule. The VCP screener overview lists every other rule, and how setups progress explains the lifecycle states.
Frequently asked questions
Why does a stock stay flat after an acquisition announcement?
In a cash deal, the buyer has agreed to pay a fixed price per share. The stock’s value becomes that price minus a small discount for time and deal risk, so merger-arbitrage buyers hold it just under the offer and daily moves shrink to a fraction of a percent.
Why does the stock trade below the offer price?
The gap, called the merger-arbitrage spread, pays holders for waiting until the deal closes and for the risk that it fails. It usually narrows as the closing date approaches and widens on regulatory or financing worries.
Can a pinned stock still break out?
Only on an event: a competing higher bid, a raised offer, or a failed deal, which usually sends the price back toward where it traded before. Those are event trades, not chart breakouts.
What happens to a stock when the acquisition closes?
In a cash deal, shareholders receive the offer price per share and the stock is delisted. In a stock deal, shares convert into the acquirer’s shares at the agreed ratio.
Does TraderSight show pinned stocks as Ready setups?
No. Stocks whose recent daily range is under 0.6% of price after a gap of 10% or more in the last 90 sessions, or under 0.3% regardless of gaps, are excluded from Ready and marked with the reason.
The stock position size calculator can calculate entry-to-stop arithmetic for a long-stock plan. It cannot estimate deal-completion risk or guarantee that an exit near a stop price is possible after a merger announcement.
Review the VCP stock screener to understand how contraction candidates are filtered before chart review, or create a free TraderSight account. Free results are one session delayed.
This article is general education, not investment advice. Deal terms, timelines, and risks vary; read the merger filings before making any decision about a specific stock.
Put this review into practice
Review real daily charts with a setup score and an explanation of the current state. Browse ranked setups and look up additional stocks free, with results one session delayed.
Educational only. Not investment advice.