TraderSight scoring turns completed daily bars into two independent research rankings. The Bullish Radar evaluates VCP-style contraction near highs; the Bearish Radar evaluates relatively weak common stocks consolidating near support. This methodology explains their inputs, lifecycle rules, and limits so you can interpret each result before reviewing the chart. Scores rank setups within their own radar, rather than estimate a probability of profit.
Turn the market close into a focused review
After each regular US market session, TraderSight evaluates a defined universe of sufficiently liquid US-listed stocks and ETFs using completed daily price and volume data. The dashboard summarizes Bullish and Bearish results separately. Open the Bullish Radar to review VCP-style bases approaching a breakout, or the Bearish Radar to review weak stocks consolidating near support and progressing toward a possible breakdown.
Create a free account to browse ranked setups, look up additional stocks, and open each setup’s chart and explanation. Standard and Premium add broader supported-market coverage, component scores, lifecycle history, watchlists, and radar emails so you can carry the same review process from one close to the next.
Review ranked setups and their explanations
Free results are one session delayed. No card required.
For a practical review sequence, use the after-close swing trading routine to move from a ranked list to a deliberately small watchlist.
How the Bullish Radar scores VCP setups
The Bullish score summarizes the quality of a bullish VCP setup; it does not estimate the probability of a profitable trade.
| Component | What it measures | Stock weight | ETF weight |
|---|---|---|---|
| Trend quality | Close above the 20- and 50-day averages, a rising 50-day, and the 20-day above the 50-day | 20% | 25% |
| Tightness | Average daily range over the last 10 sessions versus the prior 40 | 25% | 20% |
| Volume behaviour | Average volume over the last 10 sessions versus the prior 40 | 15% | 10% |
| Relative strength | 60-session return versus SPY, ranked across the whole universe | 15% | 25% |
| Moving-average structure | 10-day above 20-day above 50-day, a rising 10-day, and price not stretched above the 10-day | 10% | 10% |
| Breakout proximity | Distance below the prior 252-session high | 10% | 10% |
| Liquidity | 20-day average dollar volume | 5% | 0% |
Each component is scored 0–100, and the overall Bullish score is the weighted sum. It ranks bullish chart quality for review; TraderSight does not label a score such as 84 as an “84% chance” of any outcome.
The guide to tight consolidation swing-trade setups explains how contraction fits with trend, volume behaviour, relative strength, proximity, and liquidity without treating one component as a standalone signal.
How a bullish VCP setup develops
TraderSight screens for a volatility-contraction setup in an established uptrend, the same idea popularised as the VCP (volatility contraction pattern): price trends higher, pauses near its highs, and each pullback gets quieter until supply dries up. The VCP stock chart remains central to the review—you can inspect the contractions before treating a close above the prior high as a VCP breakout. In concrete terms:
| Rule | What we measure |
|---|---|
| Uptrend | Price above its 50-day average, the 50-day rising, and the 20-day above the 50-day |
| Near the high | Close within 5% of the prior 52-week (252-session) high for Ready |
| Contraction | Average daily range over the last 10 sessions at or below 0.75× the prior 40 sessions for Ready (0.8× for Tightening) |
| Volume dry-up | Recent 10-session volume below its 40-session baseline |
| Leadership | 60-session return versus the S&P 500 (SPY), ranked across the whole universe |
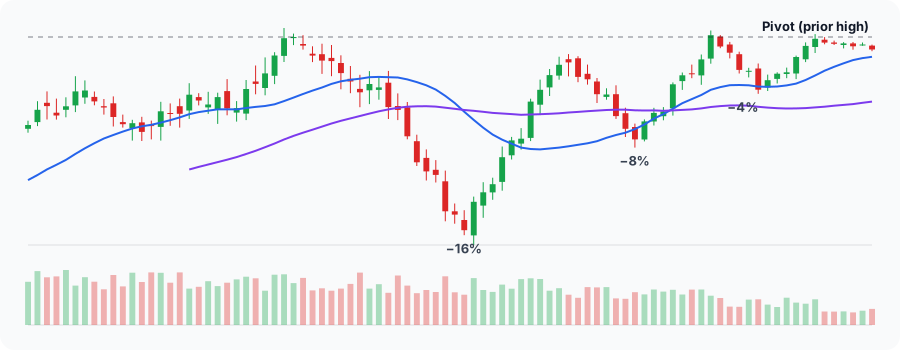
Two guards keep the list honest. A stock frozen in a razor-thin range after a large gap, which is typical of a pending acquisition, is excluded rather than shown as “tight”. A breakout that makes no new high for 10 sessions returns to the base-building states instead of staying labelled a breakout.
ETFs are scored separately. Funds put more weight on trend and relative strength and less on volume dry-up, because creation and redemption distort ETF volume. Low-volatility bond and cash-like funds never reach Ready, because their contraction is not a trading signal.
Bullish setup lifecycle states
| |
Daily explanations may identify events such as another session of range contraction, improving volume behaviour, movement closer to a recent high, a breakout, or a break below a required trend level. A setup can move backward or become invalidated as conditions change.
Read how swing-trade setups progress across sessions for the intended use and limitations of each lifecycle state. Each state also has its own guide with the exact thresholds: Developing, Tightening, Ready, Breakout, Extended, and Invalidated. The share of the market in each state is published weekly on the market breadth page.
How the Bearish Radar tracks weakness
The Bearish Radar looks for a liquid common stock that is weaker than the benchmark and already in a downtrend, then checks whether price and volatility are contracting near support. This bearish setup near support has its own eligibility checks, components, and lifecycle. It is a separate research pattern from the bullish volatility contraction pattern.
| Component | What it measures |
|---|---|
| Weakness | 60-session underperformance against the benchmark |
| Trend | Falling 50- and 200-session averages, normalized by average true range |
| Tightness | ATR contraction and the width of the recent trading range |
| Volume | Drying volume before confirmation, or expansion on a confirmed breakdown |
| Proximity | Distance from the setup’s support boundary |
The Bearish score ranks bearish setups against one another. It is not directly comparable with a Bullish score, a probability of profit, or a recommendation.
Bearish setup lifecycle states
| |
- Watch: a liquid stock is in a downtrend and weaker than the benchmark, but contraction has not qualified.
- Tightening: range and volatility have contracted in the downtrend; support has not been tested closely enough for Ready.
- Ready: price is near the frozen support boundary, but no breakdown is confirmed.
- Breakdown: price closed below frozen support by the model’s confirmation buffer.
- Failed: price reclaimed frozen support after a confirmed breakdown.
- Extended: price moved more than one frozen ATR below support.
- Expired: a pending setup did not confirm within its tracking window.
- Invalidated: the downtrend or setup boundary rules no longer qualify.
The lifecycle labels describe completed end-of-day evidence. A Ready bearish setup can fail, expire, or invalidate without ever breaking support.
Market universe and liquidity filters
TraderSight covers US stocks and ETFs in the S&P 1500, Russell 1000, Nasdaq-100, Dow 30, and a curated ETF list, about 1,600 liquid names in all. A security must close at $5 or more, trade at least $5M a day on average over 20 sessions, and have 250 sessions of history before it is ranked. A stock that belongs to several indexes is scored once.
Personalize and follow end-of-day changes
Standard gives you both full radars, their direction-specific score breakdowns and lifecycles, all radar filters, up to 3 saved views, and 2 named watchlists beside the main watchlist. It also includes end-of-day state-change alerts for selected watchlist symbols, scheduled radar emails, and the previous 20 published sessions.
Premium adds tools for following more research after the close:
- keep up to 10 saved views and 10 named watchlists;
- receive alerts when setups newly match a saved Bullish or Bearish view;
- receive watchlist score-change alerts as well as state changes;
- mark changes reviewed in the What Changed queue;
- inspect watchlist health and position sizing on setup pages; and
- reopen the previous 60 published sessions, receive a Saturday recap, and download watchlists and saved views as spreadsheets.
Saved-view alerts and watchlist alerts answer different questions. A saved-view alert reports a new match for a set of filters. A watchlist alert reports a state or score change for a symbol you selected. Both follow completed daily data and existing digest preferences; neither monitors the market intraday.
Data, timing, and limits
Source. TraderSight uses licensed end-of-day price and volume data for US-listed securities. It does not use intraday prices, fundamentals, news, or options data.
When results appear. The nightly import starts at 5:00 pm Eastern on weekdays, after the regular session closes. Scoring, the radar, and radar emails follow as soon as the import succeeds, so results are usually ready in the early evening. If the data source is slow, automatic retries can push that later. With no completed session on weekends and market holidays, nothing new is published.
Only completed sessions. An unfinished session is never scored. Before scoring, each price history is checked for duplicate or future dates, missing or non-positive values, and bars whose open, high, low, and close are inconsistent. A security with a suspect move, such as a bad print or an unadjusted split, is skipped for that run rather than scored on bad data. Relative strength is calculated only when the security and the SPY benchmark cover the same sessions.
Published as one run. Each night’s results are staged and published together, so the radar never mixes today’s scores with yesterday’s. Data freshness is shown alongside results in the app, and delayed or incomplete analysis is never presented as current. Free plan lookups are one session delayed.
What the data can’t tell you. The radar does not show earnings dates, news, or pending corporate events. Check them in your broker before planning a trade. Market data can occasionally be late, incomplete, or corrected after the fact. The score thresholds started as simple, transparent rules, and are reviewed against manual chart review and user feedback.
What TraderSight does not do
- predict whether a security will rise or fall;
- guarantee that a breakout or trade will succeed;
- provide personalized investment, tax, accounting, or legal advice;
- place trades or connect to a brokerage;
- provide real-time alerts, options data, or automated strategies;
- replace independent research, risk management, or professional advice.
Review the illustrative radar to see how the experience fits together, or compare the Free, Standard, and Premium plans.
Put the setup rules to work
Browse ranked setups and look up additional stocks. Free results are one session delayed; no card required.
Browse the radar free