Range contraction in stocks means recent daily high-to-low ranges are smaller than an earlier baseline. A tight consolidation becomes useful for bullish research when that quieter price action occurs in a qualifying uptrend, alongside lighter volume and a coherent base. One narrow candle does not establish the whole pattern.
TraderSight’s Bullish Radar calls a setup Tightening when range, volume, and trend pass its checks but the setup does not already qualify as Ready or Breakout. This guide combines chart interpretation with that specific state definition. For screening across the supported universe, use the VCP stock screener; for both independent radar models, see the scoring methodology.
How to measure range contraction
Calculate each completed session’s high minus low, then compare two averages:
Range ratio = average daily range over the latest 10 sessions ÷ average daily range over the preceding 40 sessions.
A recent average of $1.20 against a $2.00 baseline gives 0.60: daily ranges are 40% smaller. The two windows do not overlap. A ratio of 1.0 means no reduction, while a value above 1.0 means ranges have expanded. This measures the change in daily movement, not the width of the entire base.
The base-depth guide measures the separate high-to-low correction across a base. A stock can have a deep base and tight recent bars, or a shallow base with erratic daily movement. Compare like measurements rather than calling both of them “tightness.”
Bullish Tightening requirements
A setup is Tightening when all three are true on the latest completed session, and it does not already qualify as Breakout or Ready:
- Tightness score of at least 40. The average daily range (high minus low) over the last 10 sessions is about 0.8× or less of its average over the 40 sessions before that.
- Volume score of at least 30. Average volume over the last 10 sessions is about 0.85× or less of its average over the prior 40.
- Trend score of at least 50. At least two of the four trend checks pass. See Developing for the list.
Both contraction scores use the same scale: a ratio of 1.0 (no change) scores 0, and a ratio of 0.5 (half the baseline) scores 100, in a straight line between. A ratio of 0.8 scores 40 and 0.75 scores 50. The close must also be above the 50-day average, because any close below it is Invalidated before the other rules are checked.
Tight consolidation versus a loose stock base
An orderly consolidation has several small swings instead of repeated wide reversals. In a volatility contraction pattern, the pullbacks also become progressively shallower. TraderSight measures recent daily range; you still need the chart to judge those individual swings.
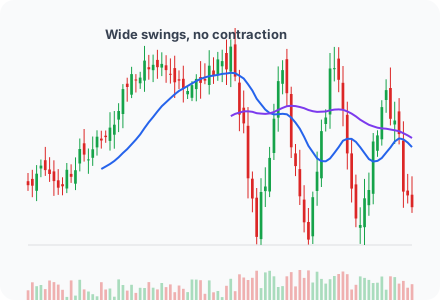
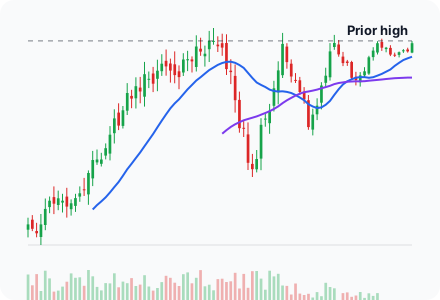
Both charts are illustrative. A quiet final range can make a possible pivot and invalidation level easier to describe, but it does not prove that selling has ended or that a breakout will follow. Recent contraction can also look unusually strong because a large earnings bar inflated the earlier baseline.
How to spot tight price action on a daily chart
Look at the last two weeks of candles against the month before. Tight action has small bodies, short wicks, and closes clustered near the same price. Several closes within 1–2% of each other is a strong sign. Wide candles that swing from one side of the range to the other are not tight, even if the overall range looks flat.
Check volume dry-up before a breakout at the same time. Lower volume describes fewer shares changing hands, rather than proof that holders have stopped selling. Review whether price holds its range or drifts lower. Compare relative strength with the benchmark as another distinct check; a quiet stock can still be lagging the market.
A Tightening setup, worked through
A fictional stock after the close, for illustration only:
| Measure | Value |
|---|---|
| Close | $63.40 |
| 20-day and 50-day averages | $62.80 and $60.20, both rising |
| 10-session average daily range | $1.12 |
| Prior 40-session average range | $1.60 |
| 10-session average volume | 1.4 million |
| Prior 40-session average volume | 1.9 million |
| Highest high of the prior 252 sessions | $70.00 |
- Tightness: $1.12 ÷ $1.60 = 0.70, a score of 60. Passes.
- Volume: 1.4 ÷ 1.9 = 0.74, a score of about 53. Passes.
- Trend: all four checks pass, a score of 100. Passes.
- Proximity: the close is 9.4% below $70.00, a proximity score of about 53.
This chart is tight enough for Ready, but it is too far from its high. Ready needs a close within 5% of $70.00, which is $66.50 or higher. Until price works back up there with the range still contracted, it stays Tightening.
Tightening compared with Ready
| Tightening | Ready | |
|---|---|---|
| Tightness score | ≥ 40 | ≥ 50 |
| Volume score | ≥ 30 | not required |
| Trend score | ≥ 50 | ≥ 75 |
| Near the 52-week high | not required | within 5% |
A setup can be tight but far from its high, for example consolidating after a pullback, as in the example above.
Where Tightening setups go next
- To Ready: the close gets within 5% of the 52-week high, the range is at 0.75× baseline or tighter, and the trend score reaches 75. See Ready.
- To Breakout: a close above the prior 252-session high moves it straight to Breakout.
- Back to Developing: ranges widen again or volume picks up, so one of the contraction scores drops below its threshold.
- To Invalidated: a close below the 50-day average, or a trend score below 50.
Mistakes to avoid when a chart tightens
- Assuming direction. Contraction can resolve in either direction. Bullish Tightening is a research classification, not a forecast, and the independent Bearish Radar uses different rules.
- Reading one quiet day as tightening. The rule uses a 10-session average for a reason.
- Ignoring where the tightening is. Tight action far below the high has more overhead supply to work through than tight action just under it.
- Missing a takeover pin. A stock frozen in a tiny range after a big gap is often waiting on an acquisition. TraderSight invalidates those, as the takeover article explains.
- Ignoring liquidity. Sparse trading can produce small printed ranges. Eligibility filters reduce that problem, but do not guarantee tight spreads or predictable fills.
Checking Tightening setups after the close
- Confirm the trend still qualifies and the close is above the 50-day average.
- Compare the last 10 sessions’ candles and volume with the prior 40.
- Measure the distance to the 52-week high. Under 5% is where Ready begins.
- Mark the top and bottom of the tight area so you know the likely pivot and stop.
- Estimate size early with the position size calculator, so the plan is ready if it moves to Ready.
This page is educational and describes how TraderSight classifies charts. It is not investment advice.