In stock trading, VCP means volatility contraction pattern: a base after an uptrend in which each pullback is shallower than the one before it. A stock might fall 20% from its high, recover, fall 10%, recover, then fall only 4%. Each swing is smaller, volume gets lighter, and price ends up coiled in a narrow range just under its prior high. The term was popularised by trader Mark Minervini.
This guide explains how to identify the pattern on a chart. To apply measurable contraction rules across US stocks and ETFs, see the after-close VCP stock screener.
Why contraction works as a setup
Each smaller pullback suggests fewer holders are willing to sell. When the range is tight and volume is quiet, little supply is left near the current price. A move through the top of the range, the pivot, then needs less buying to carry it. A tight final range also gives a close, logical stop, which is what makes the setup practical to size.
How to read a VCP stock chart
- A prior uptrend. A VCP forms after a stock has already shown strength, not in a downtrend. Price should be above a rising 50-day average.
- Two to four contractions, each smaller than the last. Measure each from its swing high to its swing low: 18%, then 8%, then 3% is a clean sequence.
- Volume drying up during the final contraction. See volume dry-up.
- A tight final range close to the prior high, often within 5% of the 52-week high.
- Smaller daily bars on the right. The last two weeks should look visibly quieter than the weeks before.
How TraderSight measures volatility contraction
TraderSight does not count individual pullbacks or measure base depth; those require you to identify swing highs and lows on the chart. Its Bullish Radar measures recent range and volume instead, on completed daily bars after each US close:
- Tightness score. The mean daily high-low range of the last 10 sessions divided by the mean of the prior 40. A ratio of 1.0 (no contraction) scores 0 and 0.5 scores 100, in a straight line, so 0.8 scores 40 and 0.75 scores 50. Real VCP bases often land between 0.6 and 0.8.
- Volume score. The same 10-versus-40 comparison on volume.
Combined with trend and distance from the high, those drive the states. Tightening needs tightness of at least 40, volume of at least 30, and a trend score of 50. Ready needs tightness of at least 50, a trend score of 75, and a close within 5% of the prior 252-session high. For stocks, tightness is the heaviest single weight in the setup score, at 25%.
The limits: a 50-session window can miss the left side of a long base, and one wide-range day in the baseline, such as an earnings reaction, makes the recent range look tighter than it is. Low-volatility bond and cash ETFs are never Ready, since their ranges are always narrow. The VCP screener page shows how the nightly scan applies these rules.
A VCP example, step by step
The chart below illustrates shrinking pullbacks and quieter volume. The labels describe fictional swings, not measured market data.
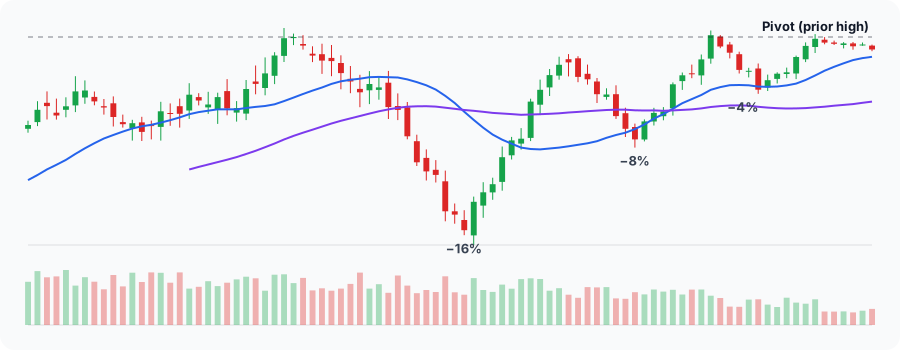
For a separate numerical example, imagine a stock that rallied from $60 to $100 over four months. Then:
- It pulls back to $82, an 18% drop, on heavy volume as early buyers take profits.
- It recovers to $98, then dips to $90, an 8% contraction on lighter volume.
- It recovers to $99, then drifts to $96, only 3%, on the quietest volume of the base.
That final 3% range, from $96 to $99, is the tight area. Its top is a natural pivot, with the prior $100 high just above. A close above $100 on strong volume would be the breakout.
Here is how the last session might score. The 10-session average range is $1.20 against $2.00 for the prior 40, a ratio of 0.60, so tightness scores 80. Volume averages 900,000 shares against 1.5 million, also 0.60, so the volume score is 80. The close of $98.20 is 1.8% below $100, a proximity score of 91. With a trend score of 100, all three Ready rules pass.
Common VCP mistakes
- Calling any sideways chart a VCP. Without a prior uptrend and shrinking swings, it is just a range.
- Ignoring volume. A tight range on heavy selling volume is distribution, not contraction.
- Buying before the pivot. Entering in the middle of the base means sitting through more pullbacks, and the stop has to be wider.
- Forcing a count. A base does not need exactly three contractions. What matters is that the last one is the smallest.
- Setting the stop too far away. The point of a tight final range is a stop just below it, usually a few percent away. Size from that distance with the position size calculator.
- Missing the takeover pin. A stock that gaps up on a buyout offer and then trades flat looks extremely tight but has no setup. TraderSight excludes these; see why a tight chart can be a takeover.
A VCP checklist for the after-close review
- Confirm the prior uptrend and a rising 50-day average.
- Measure each pullback and check that the last one is the smallest.
- Check that volume in the final contraction is below the base average.
- Note how far the close sits below the 52-week high.
- Mark the pivot, set a stop below the final range, and size the position before the next session.
For more on what “tight” means in practice, read what makes a swing-trade setup tight. This is educational material, not trading advice.