TraderSight’s Bullish Radar is an end-of-day VCP stock screener for US stocks and ETFs. After each US close, it ranks eligible candidates with contracting ranges near their highs and shows the daily chart behind each score. Review the shortlist, check whether the pullbacks are shrinking, and mark your entry and stop before the next session.
The stock universe includes eligible members of the S&P 1500, Russell 1000, Nasdaq-100, and Dow 30, alongside a curated list of US-listed ETFs. Overlapping index membership does not create separate copies of a setup. Free provides delayed Nasdaq-100 research; Standard and Premium add the latest completed-session radar and broader coverage. See plan access and trial eligibility for current limits and checkout terms.
VCP stock charts versus automated screening
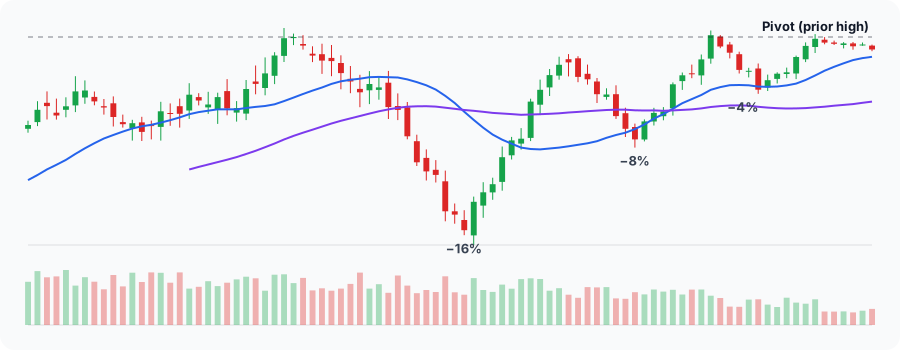
A volatility contraction pattern is an uptrending stock whose pullbacks become smaller and quieter near a prior high. The term was popularised by Mark Minervini. Visual analysis follows each swing; TraderSight measures the resulting change in daily range and volume instead.
| Review method | What it checks | What still needs review |
|---|---|---|
| Count contractions on a chart | Swing-high-to-low pullbacks, such as 16%, 8%, then 4% | Where each swing starts and ends |
| Screen with TraderSight | Last 10 sessions of range and volume versus the preceding 40 | Whether pullbacks are shrinking across the base |
Smaller daily ranges can help you find a VCP, but you still need to check the swings on the chart. An unusually large earnings bar in the earlier period can make recent bars look tight by comparison. The after-close VCP screening guide shows how to review candidates and spot misleading readings.
What the VCP scanner checks every night
| Condition | How it is measured |
|---|---|
| Uptrend | Four moving-average checks, worth 25 points each; Ready needs at least 75. See moving-average checks. |
| Moving-average structure | Shorter averages aligned with the trend, without excessive extension above the 10-day average |
| Near the 52-week high | Within 5% of the prior 252-session high for a Ready setup |
| Volatility contraction | Average daily range over the last 10 sessions at or below 0.75× the prior 40 sessions |
| Volume dry-up | Recent 10-session volume below its 40-session baseline |
| Relative strength | 60-session return versus SPY, ranked across the whole universe |
| Liquidity | At least $5 a share and $5M average daily dollar volume |
These seven components combine into a Bullish setup-quality score, with separate weights for stocks and ETFs. It ranks candidates within the Bullish Radar. TraderSight’s independent Bearish Radar studies weak stocks near support with different components; its scores cannot be compared directly with Bullish scores. The scoring methodology explains both models.
Stocks near 52-week highs, sorted by how tight they are
Plenty of stocks trade near their 52-week high. The useful question is which of them are tightening there. TraderSight sorts candidates into lifecycle states so the list stays short:
- Ready: within 5% of the prior high, with recent daily ranges at least 25% smaller than their baseline and a trend score of at least 75. Review the chart for a possible entry and a level that would invalidate the setup.
- Tightening: range and volume are contracting, but the setup still misses one or more Ready checks. It may need to move closer to its high, tighten further, or improve its trend. See the Tightening rules.
- Breakout: the stock closed above its prior high.
- Developing: the trend qualifies, but the setup has not met the contraction and proximity requirements for the later states. Watch is a separate Bearish state.
Extended and Invalidated describe later extension or a structure failure. Read the state explanation alongside the total; a high component score cannot override an invalidation rule.
A structure break can move a setup to Invalidated even when some scores remain high. Check the state explanation alongside the chart. The New today view highlights state changes since the previous close; the setup progression guide explains how to review them.
Two false positives a VCP screener should reject
Takeover pins. A stock can trade in a razor-thin range near a cash offer price after a buyout announcement. It may look like an unusually tight base, while its next move depends on the deal rather than the contraction thesis. TraderSight excludes detected pins; see why a tight chart can be a takeover.
Stale breakouts. A breakout that makes no new high for 10 sessions returns to the base-building states, so the list does not fill up with old moves.
VCP screening for ETFs
Sector and thematic ETFs form contraction patterns too, but they behave differently. Creation and redemption affect ETF volume, so TraderSight scores ETFs with more weight on trend and relative strength and less on volume dry-up. Funds with average daily range below 0.5% over 50 sessions are kept out of Ready; quiet trading can be their normal behavior rather than a useful contraction signal.
Learn the pattern first
New to volatility contraction? The VCP guide walks through an example base contraction by contraction, and volume dry-up explains the volume side. When a setup qualifies, the three rules behind Ready and the position size calculator cover planning the trade.
Scan by universe
Each part of the universe has its own guide: free Nasdaq-100 swing setup lookups, the S&P 1500 VCP scanner for large, mid, and small caps, and the ETF swing setup scanner for sector and thematic funds.
What it is not
TraderSight uses completed daily bars. It is not an intraday alert service, and a setup score is not a prediction or a recommendation. It is a ranked shortlist for your own after-close review. See the full methodology for every rule and its limits.
Build your after-close review list
Browse the free radar, or compare paid plans for the latest ranked radar across broader supported markets.
Browse the radar free